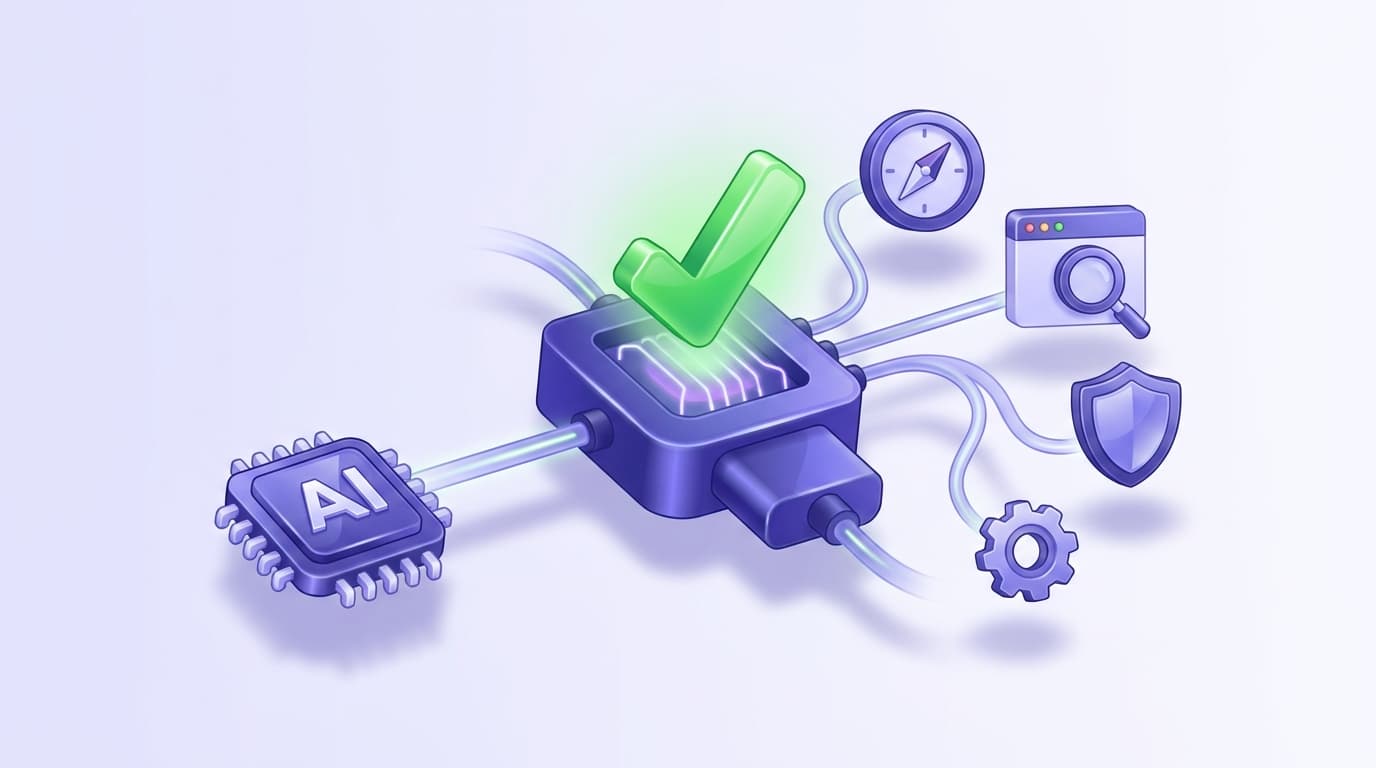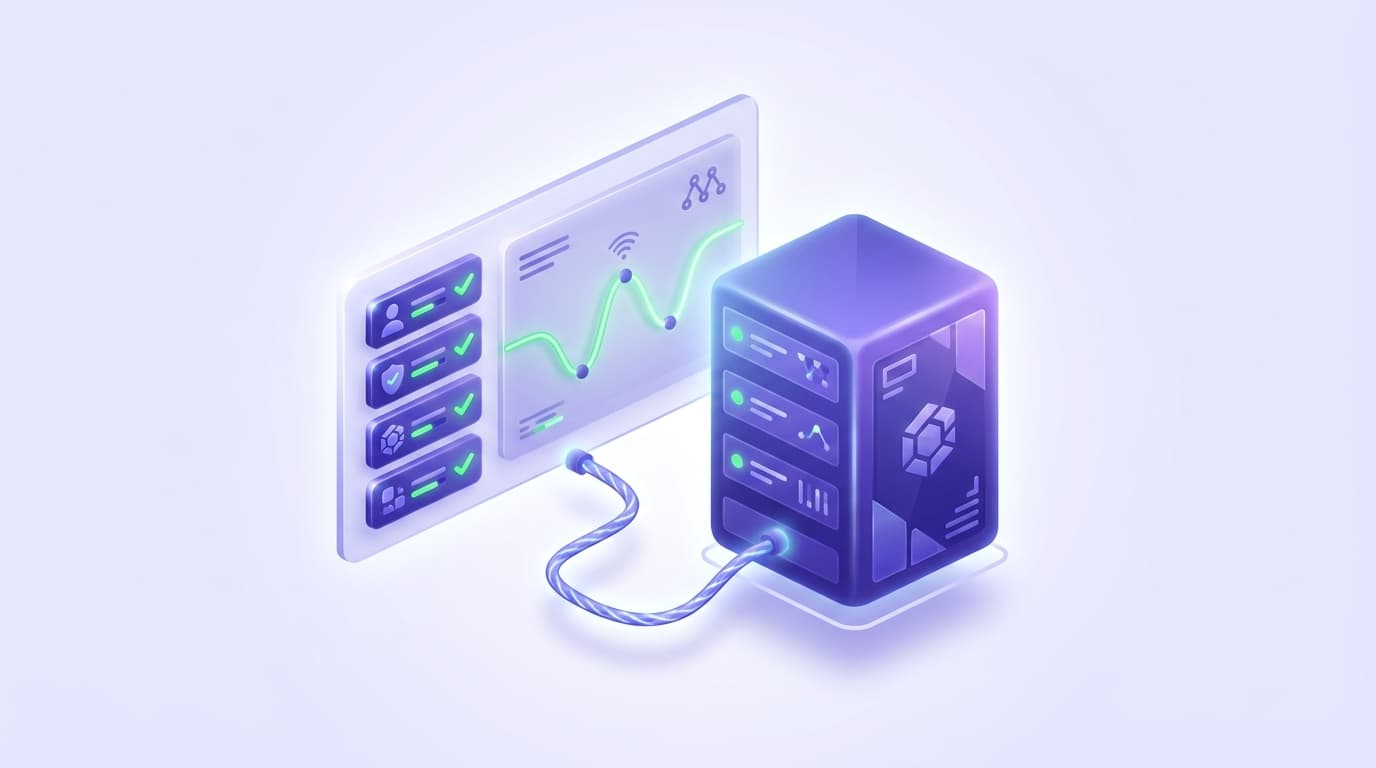
Debugging through an agent is miserable. The model decides whether to call a tool, phrases the call itself, and reports back in prose. When something fails you get "I was unable to complete that," which tells you almost nothing about whether the server crashed, returned malformed output, or was never loaded at all.
Inspector removes the model from the loop. It speaks the protocol directly, so you can see exactly what a server advertises and exactly what it returns.
What it is
MCP Inspector is a developer tool that connects to an MCP server as a client, so you can see and exercise the server without an AI model in between.
It gives you the server's advertised tool list with schemas, a way to call any tool with parameters you choose, the raw response, and the protocol traffic. That is the whole idea, and it is enough to resolve most problems in a couple of minutes.
Run it against a local server without installing anything permanently:
npx @modelcontextprotocol/inspector npx -y @shiplight/mcpThe arguments after inspector are the command that starts your server, exactly as you would put it in a client config. It opens a local web interface.
The debugging order that works
When an agent cannot use a server, work through it in this order. Each step rules out a layer.
1. Does the server start at all? Run its command directly in a terminal. A server that crashes on startup, usually a missing dependency or a bad environment variable, never gets far enough to be a protocol problem.
2. Does Inspector see the tools? Connect and look at the list. If the server starts but advertises nothing, the problem is registration inside your server, not the client.
3. Does a tool work when you call it by hand? Invoke it in Inspector with known-good parameters. This separates "the tool is broken" from "the model called it wrong," which are completely different fixes and are indistinguishable from the agent's side.
4. Now check the client config. If Inspector is happy and the agent still cannot see the server, the problem is the config file: wrong path, malformed JSON, wrong config location, or the client was not restarted.
Skipping to step 4 first is the common mistake, and it is why people spend an hour on a config that was fine.
What Inspector shows that an agent hides
The actual error. Servers return structured errors. Agents summarize them into prose, often losing the part that identifies the cause.
The tool schema as the model receives it. If a parameter description is ambiguous, the model will misuse the tool, and from the outside that looks like the model being unreliable. Reading the schema as advertised usually explains it.
Whether the tool was called at all. A frequent confusion: the agent decided not to use your tool, and reported a failure to accomplish the task. That reads like a broken tool and is actually a description problem, fixed by making the tool's purpose clearer rather than by touching any code.
Response size. A tool returning a large payload will eat the model's context and degrade everything after it. Inspector shows you what came back; the agent just gets slower and worse in ways that are hard to attribute.
Notes for people writing servers
A few things Inspector makes obvious that are easy to miss otherwise.
Tool descriptions are prompt engineering. The description is what the model uses to decide whether to call the tool. "Runs a check" gets ignored. Say what it does, when to use it, and what it returns.
Return structure, not prose. The model parses what you send. Structured output is easier to use correctly than a paragraph.
Keep responses small. Return what is needed, not everything available. Context is a shared budget and a chatty tool spends other tools' share of it.
Fail with information. An error saying what was expected and what arrived lets the model correct itself. An error saying "failed" ends the attempt.
Where this fits for testing tooling
If you are building or evaluating a server that gives an agent a browser, Inspector is how you check the browser side works before deciding whether the agent side does. Open the tool list, call the navigation tool, confirm you get a usable page representation back.
See Playwright MCP for what that representation looks like and why structured accessibility snapshots beat screenshots.
For Shiplight specifically, the tools worth exercising in Inspector before wiring an agent are the verification and test-generation ones, since those are the ones whose output you will want to read anyway.
Frequently Asked Questions
What is MCP Inspector?
A developer tool that connects to an MCP server directly, without a model in between, so you can see its advertised tools and call them by hand.
How do I run it?
npx @modelcontextprotocol/inspector followed by the command that starts your server. Nothing needs installing permanently.
My agent cannot see my server. Where do I start?
Not the client config. Check the server starts, then that Inspector sees its tools, then that a tool works when called directly. Only then look at the config.
Why does the agent ignore a tool that works?
Usually the tool description. The model decides from that text whether the tool fits the task, so a vague description reads as irrelevant regardless of what the tool does.